
Jacob Polay with Chloë Farr and Jessica Jack
This post is part of a series on AI and Collaboration.
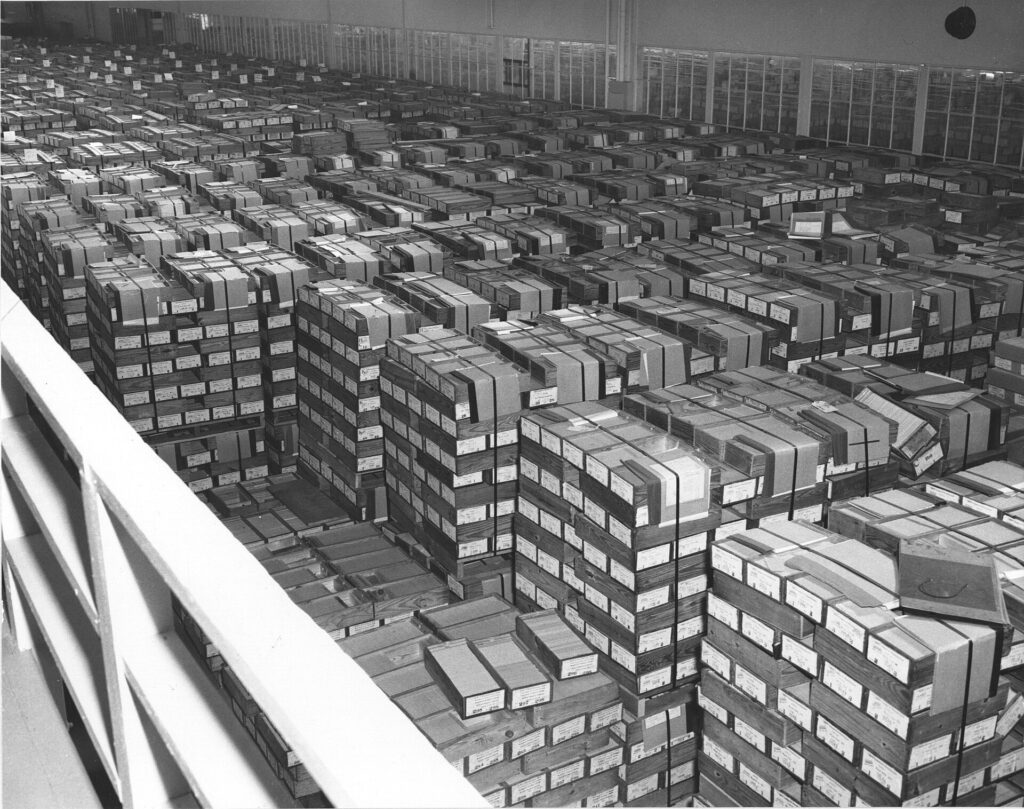
Researchers often face a dilemma when working with digital archives. Once they establish their research questions, they scour the web for digitized archival material, often finding thousands of sources. Next they are faced with the daunting task of turning this diverse array of data, composed of tables, ledgers, letters, diaries, bills, and government acts, into one set of relationships that can answer historical questions. Algorithmic transcription [OCR HYPERLINK] and entity tagging [NER HYPERLINK] help solve the first two steps of creating these relationships. These methods allow the computer to read the sources and organize their information into relevant entity groups to answer the researcher’s questions.
However, these helpful technologies still leave one crucial hurdle that must be overcome. A corpus of 20,000 documents is still 20,000 disconnected files. A search bar can only find specific words or phrases. Context is missing. It cannot answer the questions historians actually ask about the relationships between actor and entity: who traded with whom, who went where, what replaced what, and what came from where. Answering these questions at this large archival scale is much easier and faster with machines, but requires teaching the archive to hold its knowledge the way historians do. Three connected technologies now make that possible, made even more accessible with the use of an LLM.
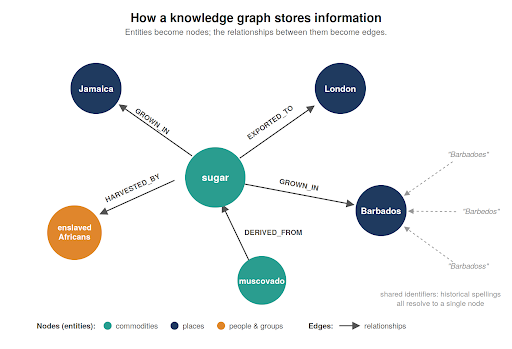
The first technology is one that humanists have been building toward for decades. Knowledge graphs store information not as tables but as relationships: entities become nodes, and the connections between them become typed edges: sugar GROWN_IN Jamaica, sugar HARVESTED_BY enslaved Africans, sugar EXPORTED_TO London. This technology may sound familiar. It’s the same structure powering software like Uber, AirBnB, and eBay, and is also the foundation of Linked Open Data which is the basis for Wikidata, Geonames, the LUX: Yale Collections, and others. These open sources publish entity-relationship data with shared identifiers so that the historical spelling “Barbadoes” in one online collection resolves to the same island as “Barbados” in others. A knowledge graph is essentially this idea at the scale of a single project: a map of every documented relationship in your corpus, queryable in milliseconds.
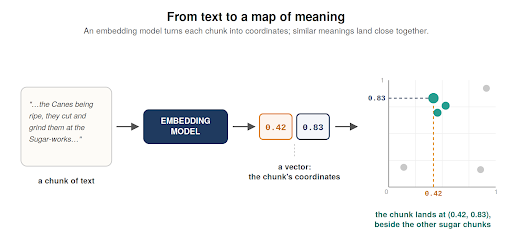
The second technology, Retrieval-Augmented Generation (RAG) is the technology behind every “chat with your documents” product, like Google’s NotebookLM. To prepare a corpus, algorithms split the text of your documents into “chunks” every few hundred words. Each chunk then passes through an embedding model, which converts it into a vector, a long string of numbers that acts like coordinates on a map of meaning. Trained on enormous amounts of text, embedding models place passages with similar meanings at nearby coordinates, so chunks about sugar, cane fields, and muscovado all cluster in the same neighbourhood. When you query a RAG system, your question is also converted into a vector, and the system retrieves whichever chunks sit geometrically closest to it. Once selected, it hands those chunks to an LLM to summarize. Importantly, the LLM draws only on the corpus you assign it and is instructed to answer from and cite only those retrieved chunks. These citations make RAG far more trustworthy than a chatbot answering from memory. In practice, however, RAG fails for history as geometry on a map produces only what is most similar to your question, not what will actually answer it. For example, when asked about sugar exports, RAG quickly returned five lyrical descriptions of sugar cane from the same poetry book, while crucial evidence in customs ledgers sat unretrieved.
GraphRAG, the third technology, combines the previous two: the knowledge graph directs the search, following edges from the entities in your question to the passages that actually mention them, before mathematical similarity narrows the results. The knowledge graph decides where to look, and the RAG decides what to read, leading to more targeted, accurate, and helpful responses.
In my MA thesis, I built one example of how GraphRAG can work for historians. From 20,000 early modern documents, I constructed a knowledge graph of 218,000 entities and 692,000 relationships, then tested eight retrieval systems on thirty historical questions of escalating difficulty and then grading each of them. Plain RAG scored 48.4 percent against the metrics of groundedness, completeness, accuracy, synthesis, and usefulness. The best off-the-shelf system reached only 61.6 percent, an unacceptable result for a careful historian.
The best performing of all, at 71.2 percent, was an architecture I designed to imitate how historians read. After significant research on my part into the appropriate architecture and approach to solving this problem, I turned to an LLM to facilitate the implementation of my chosen design. Through the help of a coding sub-agent with the LLM, I created a system that breaks a question into sub-questions, uses GraphRAG to find sources and take notes on each source separately, flags contradictions between sources instead of averaging them into false consensus, and queries the knowledge graph directly when a question needs numbers. Asked how Caribbean ginger exports changed over sixty years, this “historical-thinking” system parsed through the records and queried the knowledge graph to return a sourced, decade-by-decade answer no similarity-based system could produce because no single page of prose contained a sixty-year summary. The answer existed only in the relationships formed in the aggregate: exports surged between 1706-1708, had a mid-century revival between 1733-1735, and then faced a precipitous drop after 1744, falling to under 90% of the 1735 peak.
While the knowledge graph above was built for a single project by a single researcher, the future of GraphRAG in history should not be solitary. Knowledge Graphs are collaborative by design. Their application in Linked Open Data repositories means that a “Barbados” from my project could link to a “Barbadoes” in yours. Imagine, for example, several graphs built for different projects but sharing temporality, geography, or theme—Caribbean slavery, English criminal courts, North American colony registers—resolving the same people, places, organizations, and commodities. In the future, historians could use this interoperable data within a GraphRAG system so that one query surfaces evidence from all graphs. Getting to this point requires historians of every specialty contributing: creating manual gold-standard documents, ontologies, test questions, and blind grading of the GraphRAG systems.The pipeline I built was simply a prototype of what could happen through collaboration. The archive is too big to read alone.
Jacob Polay is a PhD student in History at the University of Saskatchewan, studying the roles Large Language Models have in the historical method. His current research involves creating an information retrieval pipeline using artificial intelligence tools to unlock the early modern archive at scale.
Chloë Farr is a researcher working at the intersection of artificial intelligence, archives, and digital humanities. Working out of the Open Science Lab at TIB – Leibniz Information Centre for Science and Technology, her research focuses on large-scale text recognition and analysis of historical documents, including newspapers, maps, and archival records. Learn more about Farr’s work on GitHub.
Jessica Jack is a PhD student in History at the University of Saskatchewan, developing applications for Large Language Models in historical research. They are doing so through studying settler land use in late 19th century and early 20th century Saskatchewan.
This work is licensed under a Creative Commons Attribution-NoDerivatives 4.0 International License. Blog posts published before October 28, 2018 are licensed with a Creative Commons Attribution-NonCommercial-ShareAlike 2.5 Canada License.